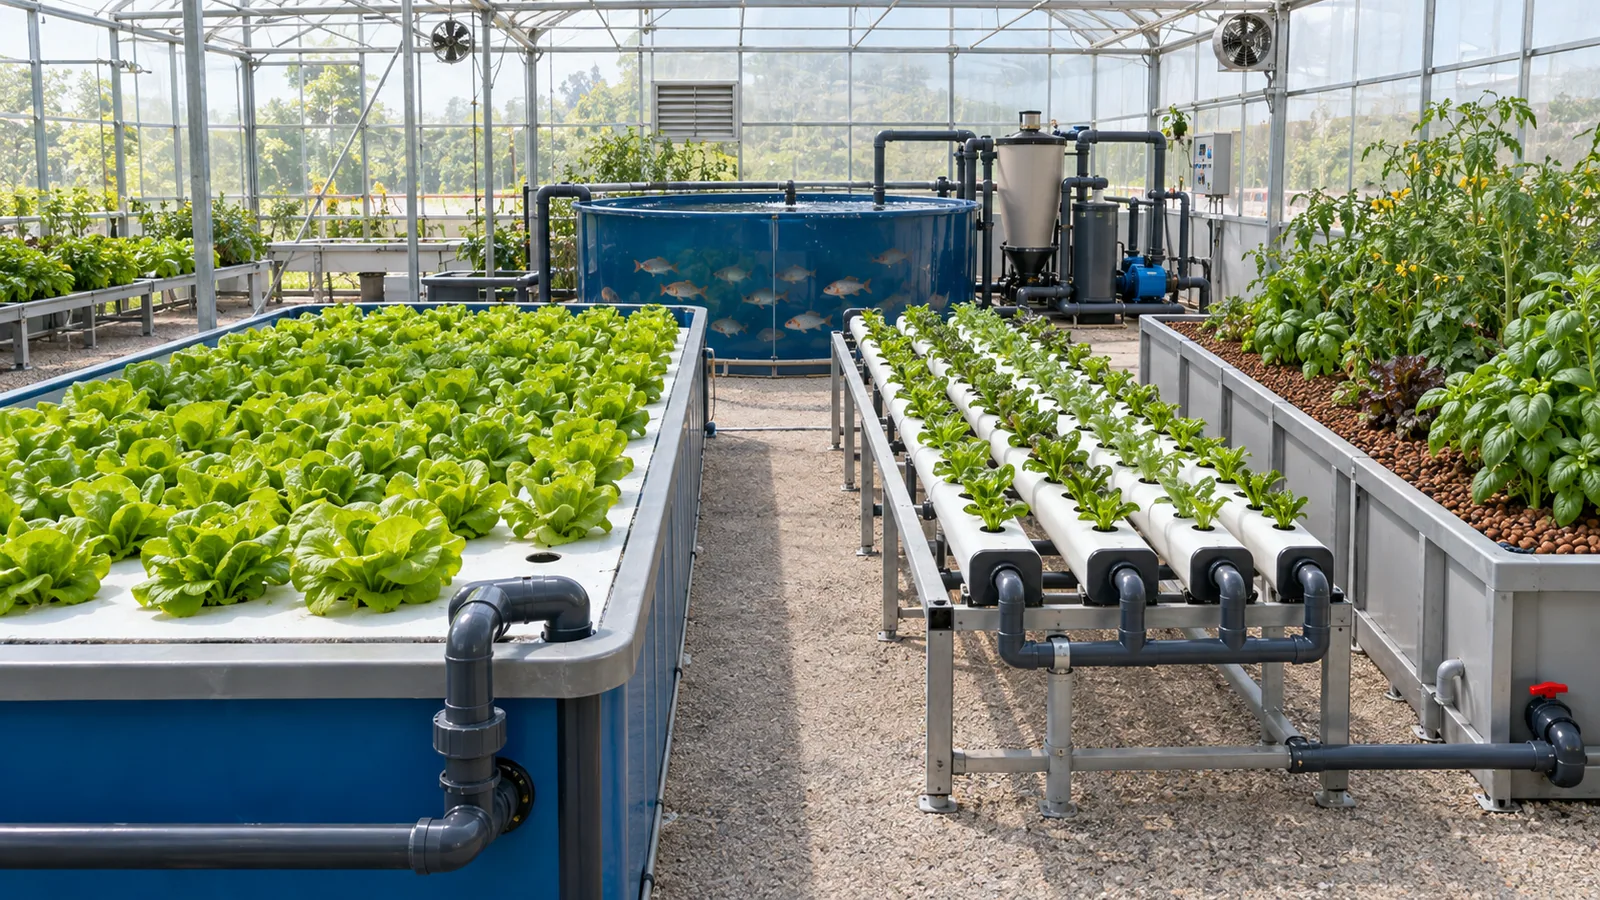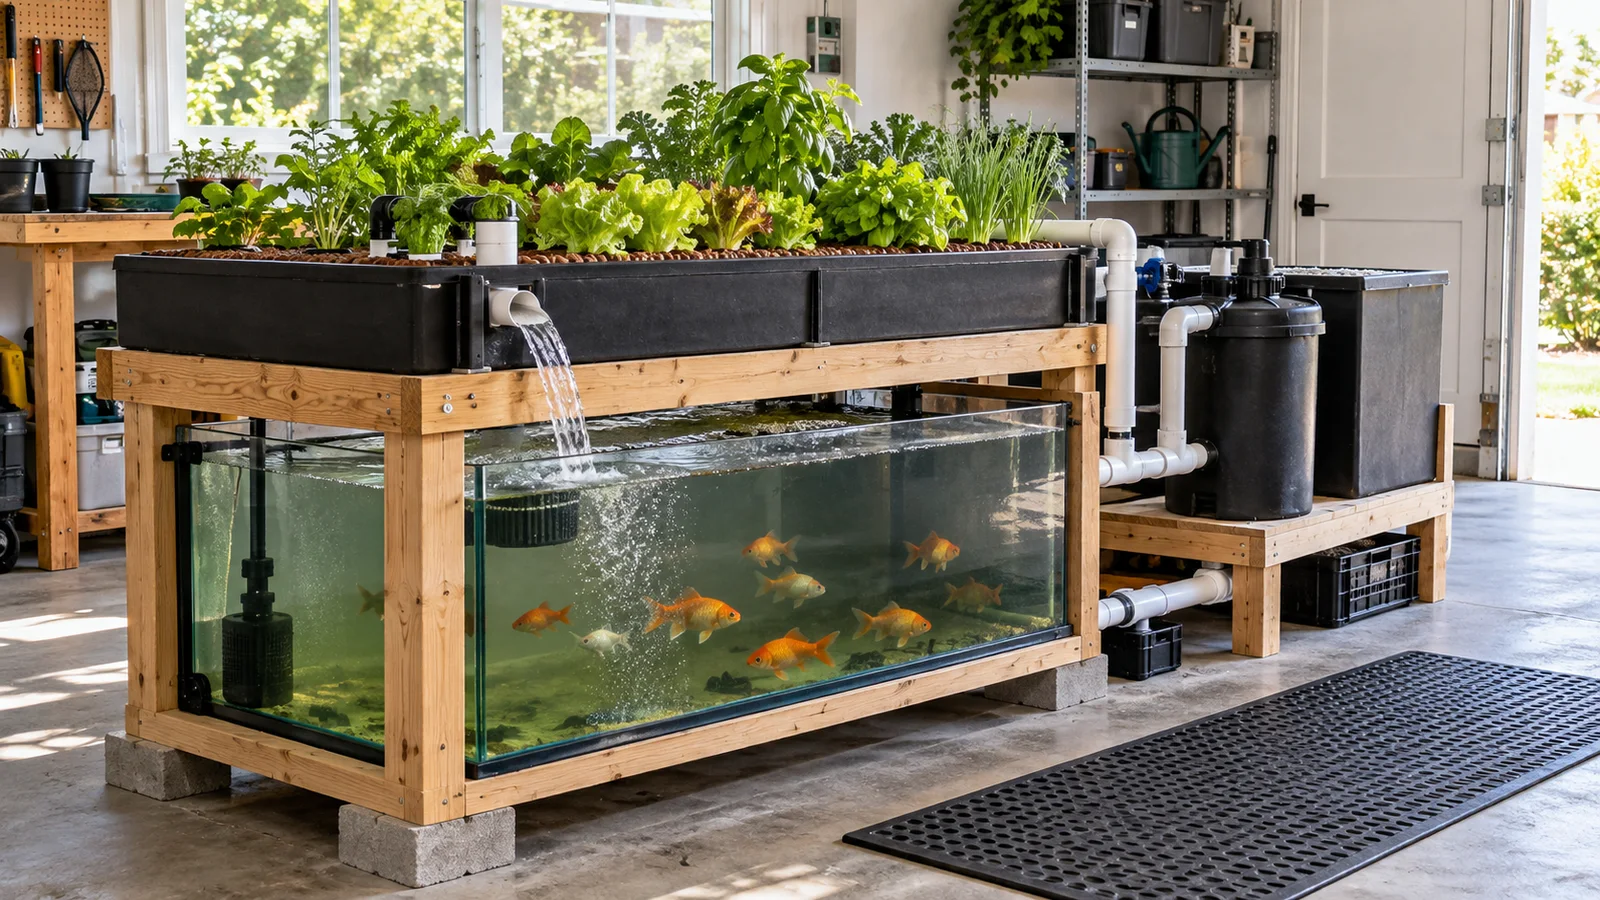
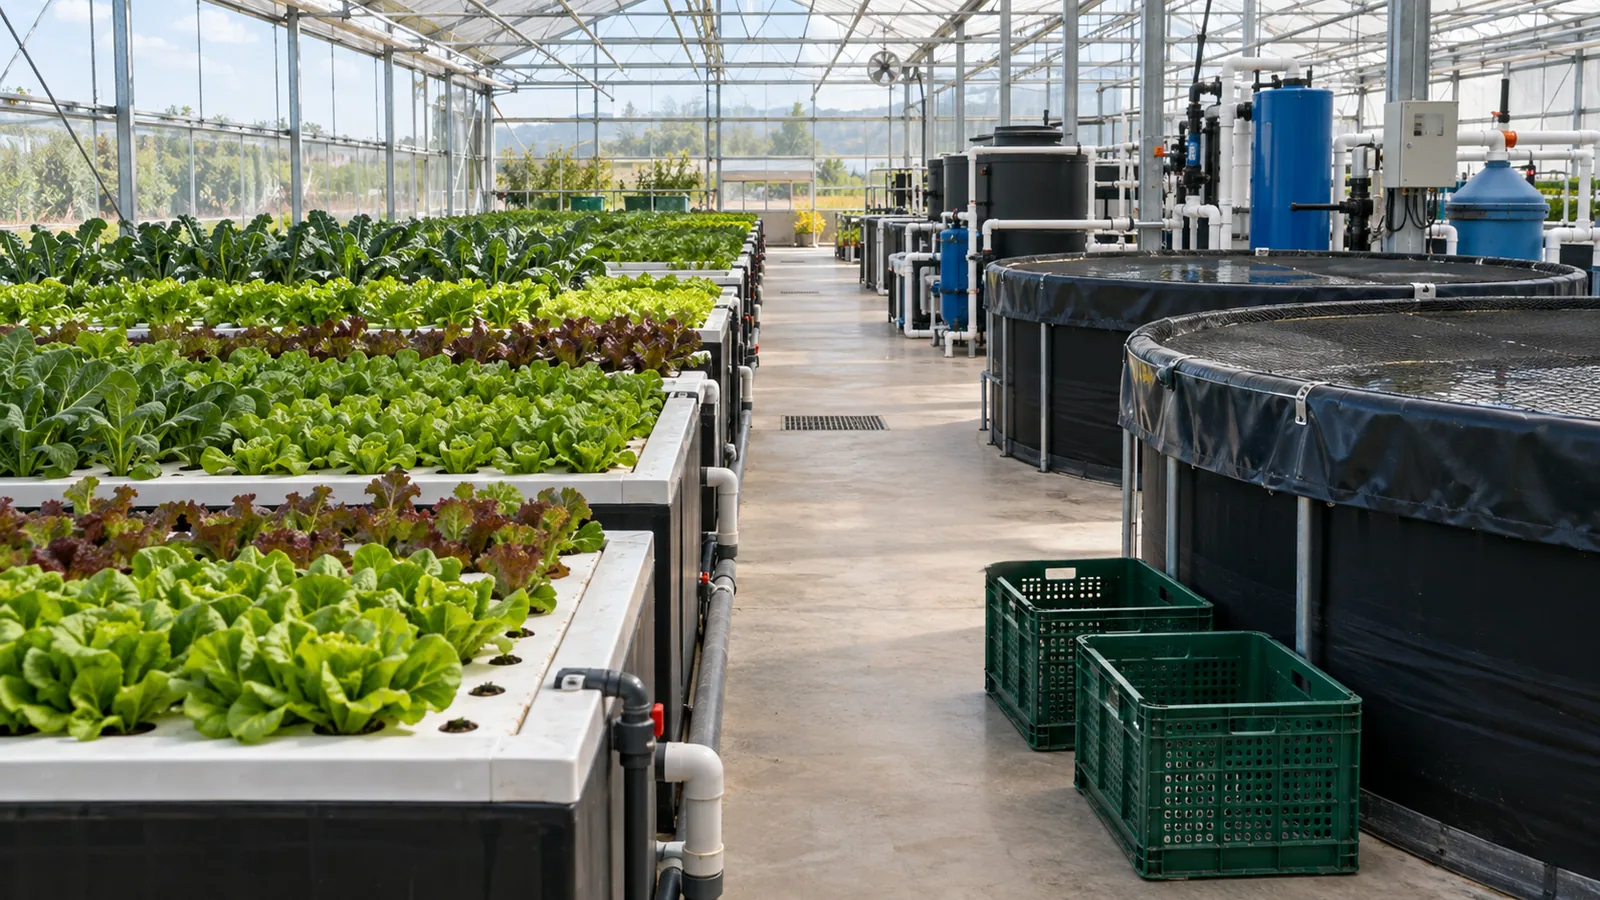
An aquaponics system can produce vegetables, herbs and—when it uses an edible species under suitable local rules—fish. The amount is not determined by tank volume alone. A credible estimate combines usable growing area, crop spacing, crop time, marketable harvest weight, planting success, fish growth, survival, feed input, water temperature, light, filtration capacity and operator performance.
For planning, separate plant production from fish production and estimate each on a monthly or annual basis. Count only marketable or genuinely usable harvest, not installed planting holes or maximum fish biomass. Then compare the estimate with the household, restaurant or commercial demand the project is meant to serve.
Aquaponics can supply a useful stream of fresh greens and fish, but a small system should not be presented as complete household food independence. Leafy vegetables have high fresh weight and nutritional value but relatively low calories. Fish harvest is periodic rather than continuous unless multiple cohorts are carefully managed. A realistic production plan explains what food, how much, how often and under which operating assumptions.
The Short Answer
Estimate aquaponics food production with two separate calculations.
For plants:
Annual marketable plant harvest = active planting sites × crop cycles per year × average marketable weight per plant × packout rate
For fish:
Annual live fish harvest = number stocked × survival rate × average harvest weight × harvest batches per year
These formulas create a planning estimate, not a guarantee. They must be constrained by actual growing area, daily feed input, biofilter and aeration capacity, seasonal temperature, crop health, fish welfare and the time available for planting, grading, cleaning and harvest.
Start with conservative assumptions, collect real harvest records for at least several crop and fish cycles, and update the forecast from measured results.
First Define What Counts as “Food”
Food production can be reported in several ways, and each answers a different question:
- Heads or bunches harvested
- Kilograms of marketable vegetables
- Kilograms of live fish
- Edible fish yield after processing
- Weekly servings for a household or kitchen
- Saleable packs meeting a buyer’s grade
- Calories, protein or selected nutrients
- Revenue from accepted products
Do not add one kilogram of live fish to one kilogram of lettuce and call the result equivalent food. They have different edible fractions, nutritional value, storage life and market use. Report them separately, then create a combined operational summary if needed.
A household may value a varied weekly harvest even when total mass is modest. A restaurant may need a fixed number of uniform basil bunches on specific days. A commercial grower may care about marketable kilograms per square metre and rejection rate. Define the decision before choosing the metric.
Production Is Limited by More Than Planting Holes
A raft with 100 holes has space for 100 plants, but that does not prove it can deliver 100 marketable plants every cycle. Some positions may be kept empty for access or hydraulic reasons. Seedlings may fail. Plants can be undersized, damaged by pests or rejected at grading. After harvest, the site may remain empty while the next seedling develops.
The existing guide to how many plants an aquaponics system can support calculates physical and nutrient-supported capacity. Food-output planning begins after that capacity has been established. It asks how often each usable position turns over and what percentage becomes an acceptable harvest.
Fish capacity has a similar distinction. Maximum standing biomass is not annual fish output. Fish need time to grow, and a harvest removes biomass and changes feed input. The system may have a restocking gap, multiple size groups or a quarantine period. Production planning must follow the real fish calendar.
Calculate Plant Production Step by Step
1. Count active production sites
Measure the growing area and count only positions that can be planted, inspected and harvested safely. Exclude shaded holes, service gaps, damaged channels, positions beside drains and any location that cannot maintain suitable flow.
For media beds with irregular crop spacing, calculate usable planted area rather than forcing the layout into a net-pot count. For towers, confirm that lower pockets receive enough light. For NFT, consider root space and channel flow as well as canopy spacing.
2. Set the marketable harvest specification
Define the crop, cultivar and target product. “Lettuce” may mean baby leaves, a small living head or a full head. Basil may be sold as individual bunches, repeated cuts or whole plants. Tomatoes may be graded by size and quality.
Use the target specification to set expected crop time and harvest weight. Avoid copying a yield from a system that used a different cultivar, light level, climate or product grade.
3. Estimate complete crop cycles
Crop cycles per year are not simply 365 divided by the seed packet’s maturity date. Include nursery time where it occupies production resources, transplant recovery, harvest work, channel or raft cleaning and any seasonal slowdown.
If a crop takes 35 days in the production zone and the team needs two days to clean and replant, the theoretical turnover is based on 37 days. Even then, holidays, seedling shortages and maintenance can create additional gaps. Use a utilization factor or measure actual occupied days.
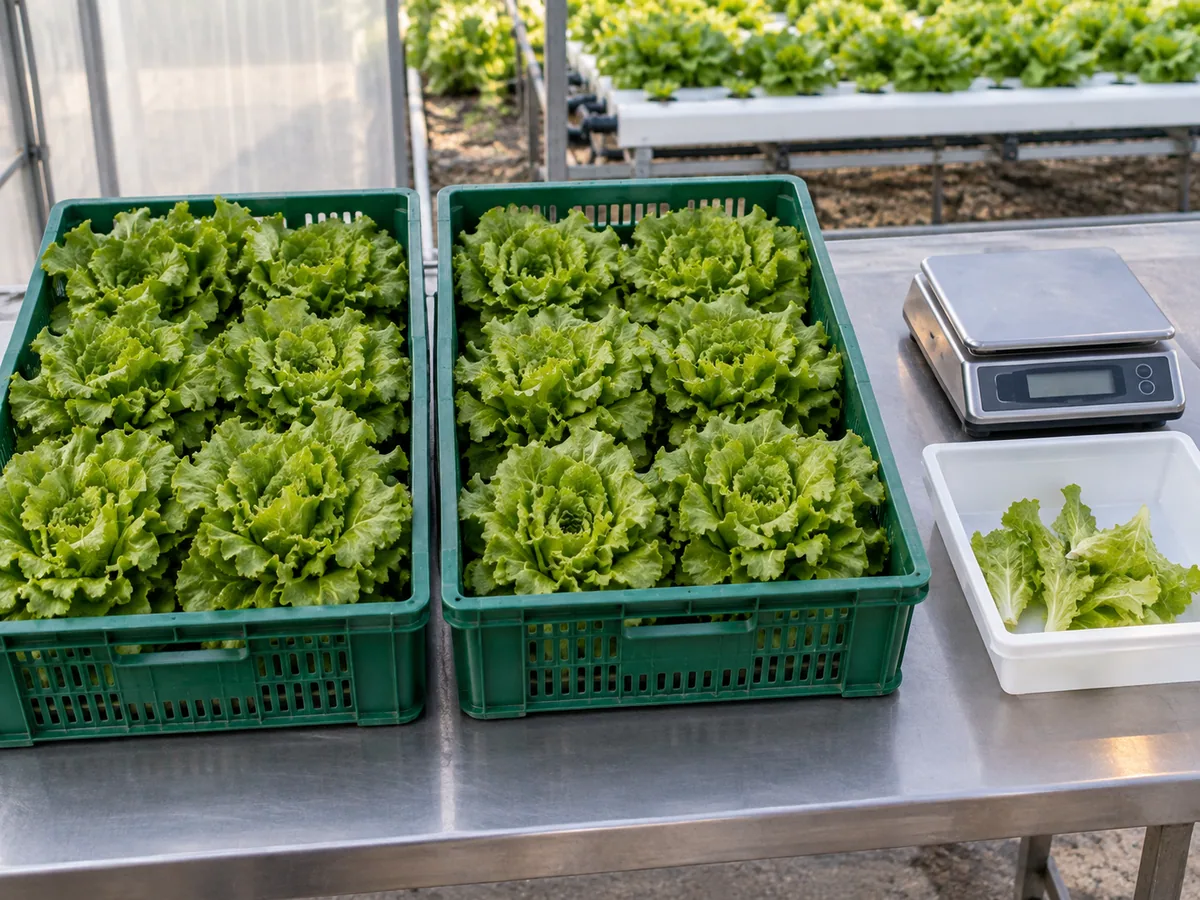
4. Apply a packout rate
Packout rate is the portion of harvested product that meets the intended use or buyer specification.
Packout rate = accepted harvest quantity ÷ total harvested quantity
For a household, an imperfect leaf may still be usable. For a retailer, the same plant may be rejected. State the standard. A forecast using 100 percent packout hides ordinary crop losses and creates an inflated result.
5. Calculate an illustrative result
Consider a home system with 48 active leafy-green positions. Assume eight complete production cycles per year, an average accepted fresh weight of 0.22 kg per plant and an 85 percent packout rate:
48 × 8 × 0.22 kg × 0.85 = 71.8 kg of marketable leafy greens per year
That is an illustration, not a promised yield. If warm-season conditions extend crop time, the system may complete fewer cycles. If plants average 0.16 kg, output falls. If the household harvests young leaves continuously, counting full heads may be the wrong method entirely.
Calculate Fish Production Separately
1. Use planned harvest biomass, not fish count alone
Twenty fingerlings and twenty harvest-size fish place very different loads on the system. The fish plan should include species, legal source, starting weight, target weight, temperature, feed, expected survival, grading and harvest method.
2. Build a cohort schedule
A single batch produces a periodic harvest. Staggered cohorts can spread output, but multiple sizes may require separate tanks or careful management to limit competition and handling stress. Do not promise weekly fish harvest from one small tank without showing how cohorts, quarantine and restocking work.
3. Apply survival and actual harvest weight
Suppose 20 fish are stocked, the planning survival assumption is 90 percent, and the average harvest weight is 0.60 kg:
20 × 0.90 × 0.60 kg = 10.8 kg live fish per completed batch
Live weight is not edible fillet weight. Processing yield varies with species, fish size and whether the product is sold whole, gutted or filleted. Use a species- and market-specific documented yield rather than a universal percentage.
4. Keep biomass within life-support capacity
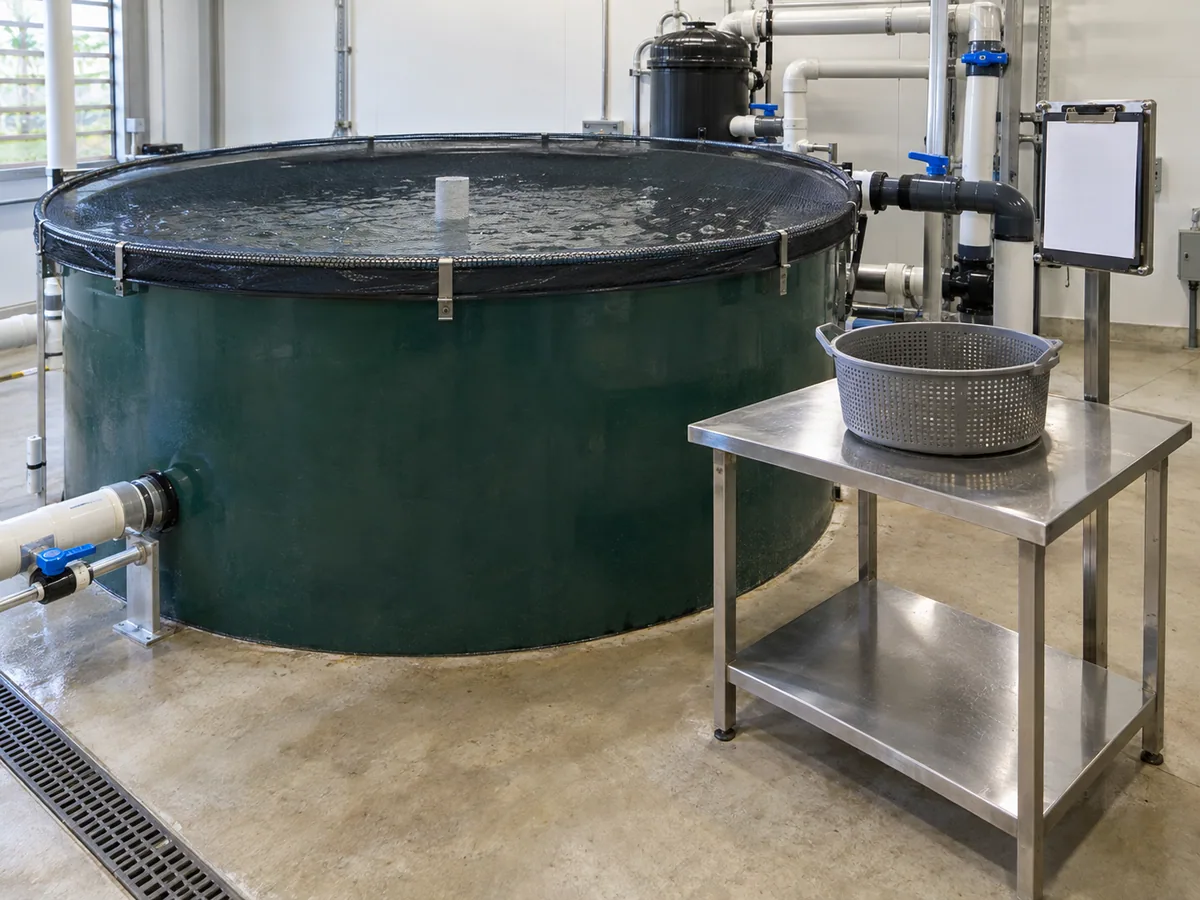
Never increase stocking merely to reach a food target. Oxygen delivery, biofiltration, solids removal, tank geometry, temperature and emergency backup must support peak biomass and feed. The guide to fish stocking in aquaponics explains why stocking should be based on biomass and treatment capacity rather than a fixed number of fish per gallon.
Connect Plant Output to Feed and Nutrient Supply
Fish feed is a major planned nutrient input. The fish retain some nutrients, while dissolved and mineralized wastes make part of the remainder available to plants. Therefore, planted area and plant output cannot be expanded independently of the feed, fish and treatment plan.
A low fish biomass may not support a large mature crop zone without a deliberately managed supplement strategy. Excess feed used to push plant production can overload oxygen, solids and biofiltration. The goal is not to maximize either side in isolation; it is to operate within the biological and hydraulic capacity of the combined system.
The actual relationship also changes through the year. Feed may decline in cool water. Plant demand may rise under strong light. A large crop harvest suddenly reduces nutrient uptake while fish continue to be fed. Staggered planting can smooth demand, but records are still needed.
Compare System Types Without Assuming Equal Yield
Media beds
Media beds can support a varied crop mix and larger plants, but irregular spacing makes standardized output harder to calculate. Media can also collect solids and roots, affecting maintenance and long-term usable area.
Deep-water culture
DWC rafts can provide organized spacing, batch movement and repeatable leafy-green workflows. Output depends on upstream solids removal, aeration, water temperature, light and crop handling. A high hole count is useful only when the system supplies healthy seedlings and uniform conditions.
Nutrient film technique
NFT can use space efficiently for compact leafy crops and herbs. It is sensitive to flow interruption, solids and root blockage. Production estimates should include positions lost to maintenance and any downtime after a channel problem.
Vertical systems
Vertical towers advertise many planting pockets in a small footprint, but light distribution, access, flow and labor determine how many are productive. Calculate output by active, adequately lit positions—not total molded pockets.
A peer-reviewed study of the PAFF Box compared plant yield, fish production capacity, water use and energy use in a specific small-scale installation and found substantial performance differences between the tested growing methods. Its results demonstrate why production data must stay attached to the system and operating conditions from which it came. Review the University of Liège research record rather than transferring one study’s output directly to an unrelated project.
Climate and Light Often Set the Real Ceiling
Plants require adequate light to turn planting capacity into harvest. A greenhouse in winter, an indoor room with limited LED output and an outdoor system during extreme heat will not complete the same number of cycles. Measure or model the crop environment rather than assuming year-round output.
Fish production is also temperature-dependent. Feeding and growth can slow outside the suitable range for the selected species. Heating may support production but introduces energy cost, equipment capacity and failure risk. A forecast should therefore include at least a normal, favorable and adverse-season scenario.
When selecting a home project, match the production target to utilities, structural load and available care time. The guide to choosing an aquaponics system size for home use helps translate food goals into a practical footprint without assuming that the largest tank is automatically the best choice.
Labor and Nursery Capacity Affect Output
A production bed cannot stay full without a nursery supplying healthy transplants. Record germination, transplant success and the number of seedlings ready each week. If 20 lettuce sites are harvested weekly but only 14 suitable seedlings are available, installed capacity will not become output.
Labor affects timing and quality. Daily fish observation, feeding, water testing, seeding, transplanting, pest checks, filter maintenance, harvesting and cleaning compete for time. Commercial forecasts should include packing and rejected product. Household estimates should account for travel and holidays.
An automated monitor can alert an operator, but it cannot grade fish, remove dead plants, clean roots from channels or replace a failed seedling batch. State the human workload behind the yield estimate.
Mid-Article CTA — Turn a Food Goal Into a System Brief
Need to compare system sizes against a weekly plant and fish target? Ask for a Product Catalog and send the available area, destination climate, preferred crops, fish plan and expected operating schedule.
Use a Three-Scenario Yield Forecast
Avoid one precise number. Build three scenarios:
| Input | Conservative | Expected | Favorable |
|---|---|---|---|
| Active plant sites | Lower after access allowance | Normal verified count | Full verified count |
| Crop cycles/year | Seasonal slowdown included | Normal schedule | Strong nursery and climate performance |
| Average accepted weight | Lower historical result | Current average | Demonstrated upper result |
| Packout | Includes normal rejection | Verified recent rate | Best demonstrated rate |
| Fish survival | Cautious planning value | Verified farm average | Demonstrated result only |
| Fish harvest weight | Minimum accepted size | Target average | Demonstrated average |
Do not use the favorable column as a sales promise. It is a sensitivity case. The expected case should become more accurate as operating data accumulate.
Create a Production Record That Can Improve the Estimate
For plants, record:
- Crop and cultivar
- Seed and transplant dates
- Active position count
- Harvest date
- Total fresh weight
- Marketable weight or accepted units
- Rejection reason
- Crop loss and cause
- Production-zone days
For fish, record:
- Species and cohort
- Source and stocking date
- Number and starting biomass
- Feed used
- Sample weights
- Mortality
- Harvest number and live weight
- Product form and edible yield where measured
Also record temperature, light schedule, significant water-quality events, equipment downtime and maintenance. Yield without context can be misleading. A low crop result during a heating failure should not become the permanent system expectation, but it should remain in the risk history.
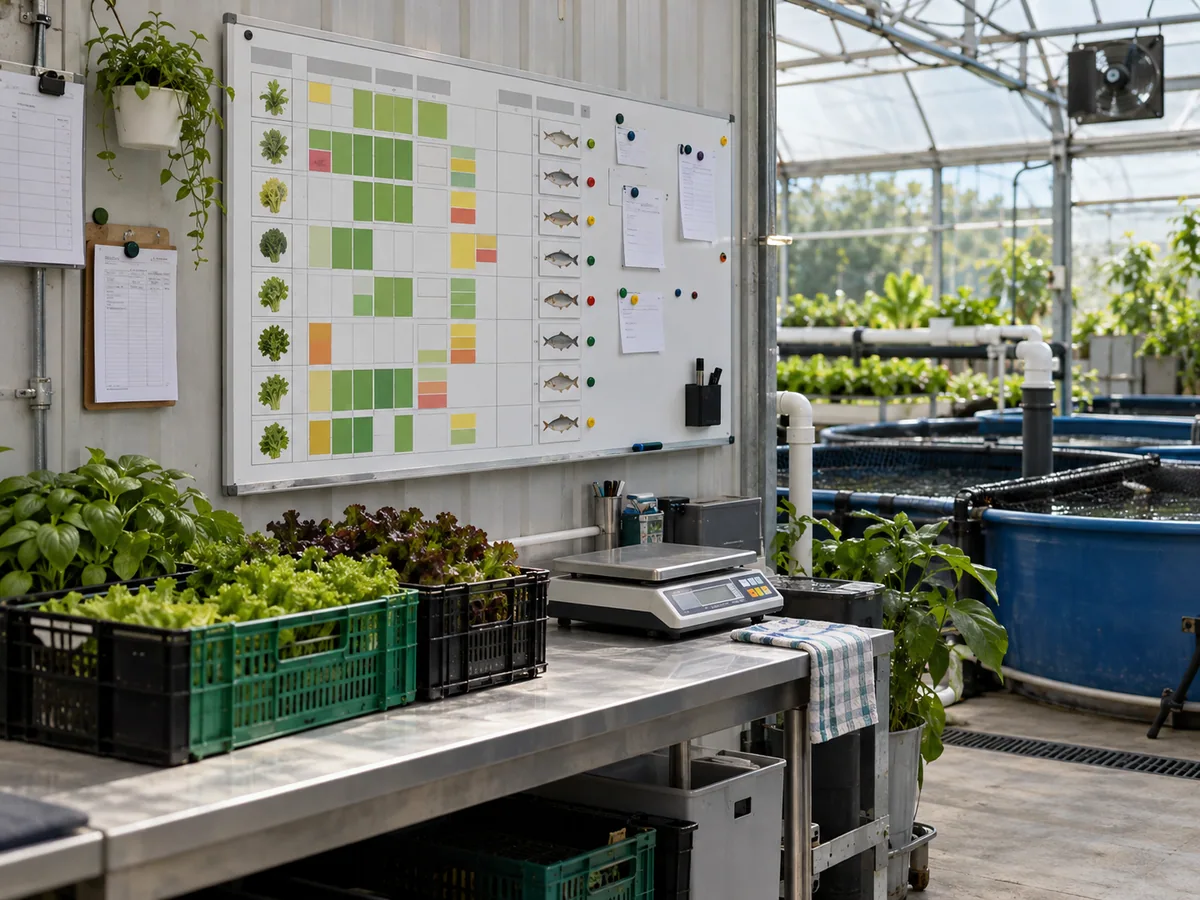
The JICA Technical Manual for Management of Aquaponics Combined with Open Culture illustrates how system management, production data and economic information can be documented together. Use such technical manuals to structure records, while adapting assumptions to the local species, climate, scale and market.
Evaluate Supplier Production Claims
When a supplier states an annual output, request the calculation basis:
- Active growing area and planting density
- Crop, cultivar and harvest specification
- Crop cycles and nursery assumptions
- Average marketable weight and packout
- Fish species, starting size and target size
- Survival and feed-conversion assumptions
- Water-temperature and light conditions
- Labor and maintenance schedule
- Downtime and seasonal reductions
- Evidence from a comparable operating system
Factory testing can prove that pumps, valves, tanks, filters and controls operate as specified. It cannot prove an annual biological yield in a customer’s climate. Shipment inspection can verify that modules, fittings, spare parts and manuals are present, but the customer’s output still depends on installation preparation and operating management.
Avoid guaranteed-yield language unless the contract defines every relevant condition, measurement method and remedy. A credible supplier explains assumptions and boundaries.
FAQ
Can a small aquaponics system feed a family?
It can provide a useful quantity of greens, herbs and possibly periodic fish, but “feed a family” is too broad without defining diet, calories, system size, climate and operating skill. Small systems are generally better presented as supplemental fresh-food production than complete food independence.
How many vegetables can one fish support?
There is no dependable one-fish-to-plant rule. Fish size, feed rate, feed composition, crop type, plant stage, solids management and nutrient supplementation all matter. Use daily feed and growing-area relationships as design inputs, then verify with system records.
Does a larger fish tank always produce more food?
No. A larger tank adds water volume, but production also requires adequate fish biomass, oxygen, filtration, plant area, light, climate control and labor. An oversized tank with insufficient treatment or growing area does not create proportional harvest.
Which crop produces the most food?
The answer depends on whether “most” means fresh weight, calories, revenue or harvest frequency. Leafy greens can turn over quickly, while fruiting crops have longer cycles and different nutrient and support needs. Select crops around the intended use and local conditions.
Should theoretical yield be used in a business plan?
Only as a clearly labelled scenario. A business plan should include conservative and expected cases, marketable packout, labor, energy, mortality, crop loss, maintenance and downtime. Replace assumptions with verified operating data as soon as possible.
How soon will the system reach full output?
Not immediately. Cycling, fish growth, crop establishment, operator learning and seasonal conditions all affect ramp-up. Plan a staged commissioning period rather than reporting first-year production as if every module operated at mature capacity from day one.
Conclusion
Aquaponics food output is the sum of real plant harvest and real fish harvest—not tank size, planting-hole count or peak standing biomass. Calculate plant output from active positions, complete crop cycles, accepted harvest weight and packout. Calculate fish output from stocked cohorts, survival, harvest weight and completed batches. Then test both against light, temperature, feed, filtration, oxygen, labor and downtime.
A cautious estimate may appear less impressive than a headline yield, but it is more useful for purchasing and production planning. Once the system is operating, measured records can replace assumptions and show whether expansion is justified.
Final CTA — Request a Production-Oriented System Proposal
Want a system scope built around a defined harvest target rather than an unsupported yield claim? Send Your Requirements with your available area, crops, fish species, destination, utilities and weekly production goal.